Dashboard
When to use
Use the Dashboard to track general indicators once resources, crops, areas, beds, and plans start generating operational data.
Pre-conditions
- Logged in.
- Organization selected.
- Operational data registered so indicators are not empty.
Sample data used
- Authorized sandbox organization.
- Demo production plan with a linked crop, area, and beds.
Step by step
- Go to
/:organizationId/dashboard. - Check the displayed cards and charts.
- Compare indicators with the source modules: resources, plans, tasks, and upcoming events.
- If the screen is empty, first create the data described in the related guides.
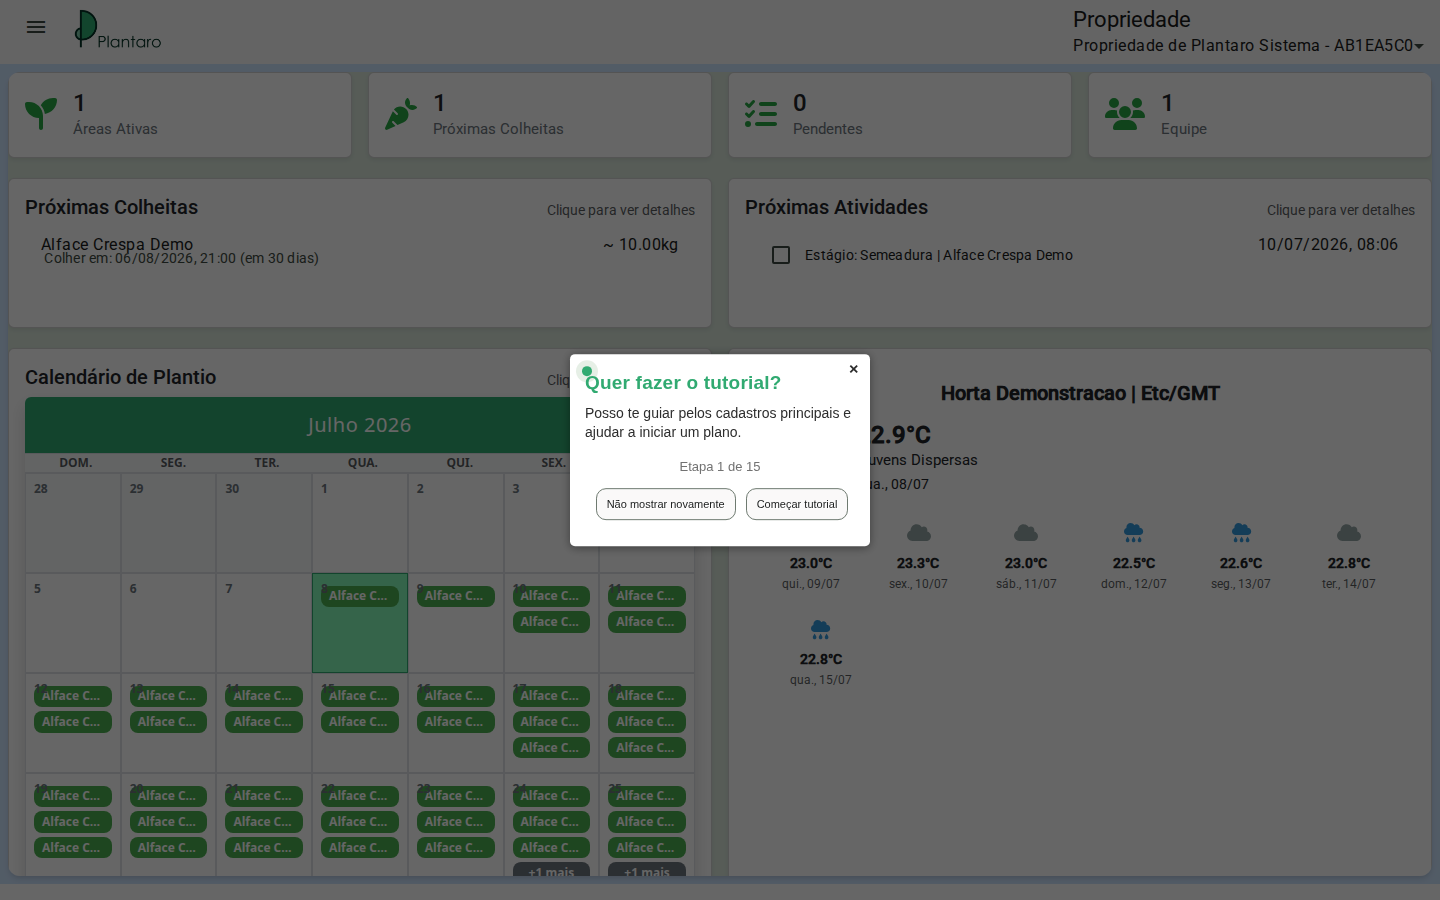
Expected result: the Dashboard shows a consolidated view of the operation, with indicators consistent with the registered data.
Errors and empty states
-
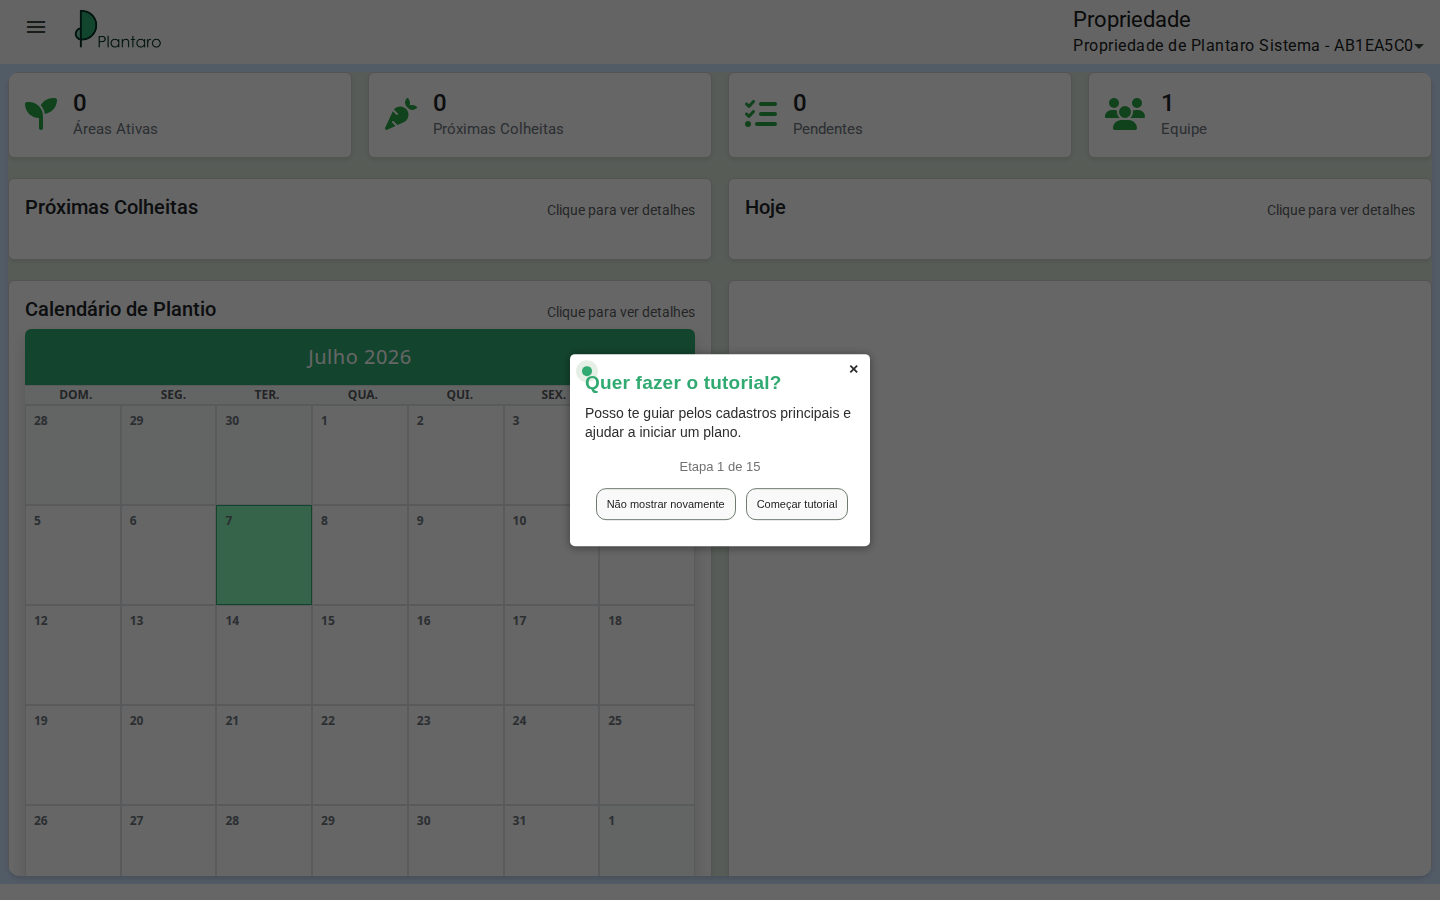
Empty dashboard: indicates a new organization or lack of operational data.
-
Permission error: confirm the user belongs to the organization in the URL.
-
Unexpected indicator: review filters, active organization, and source data.